.
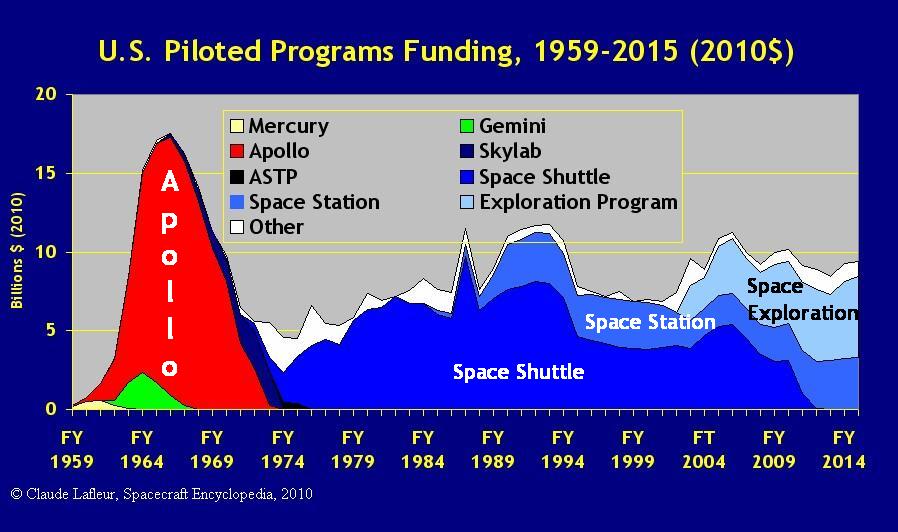 |
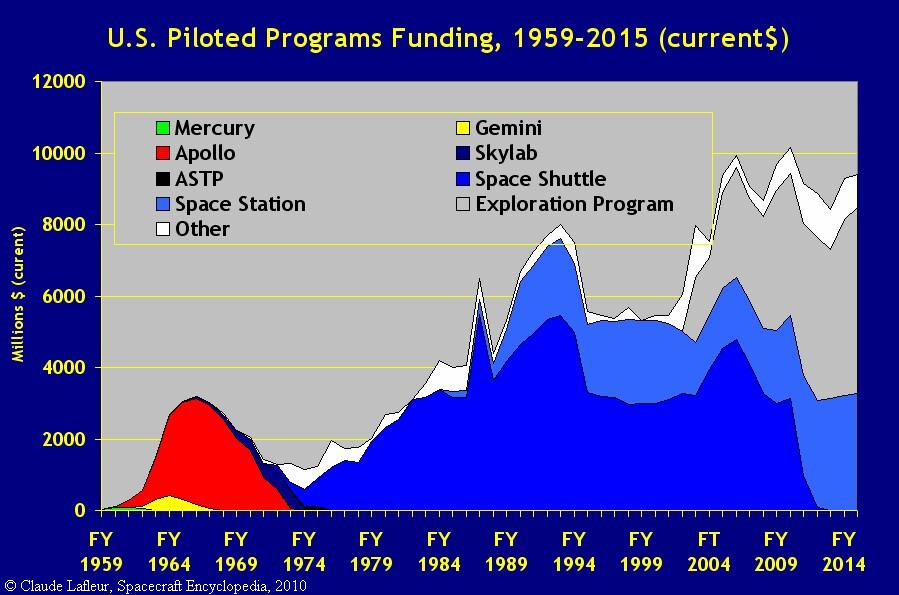
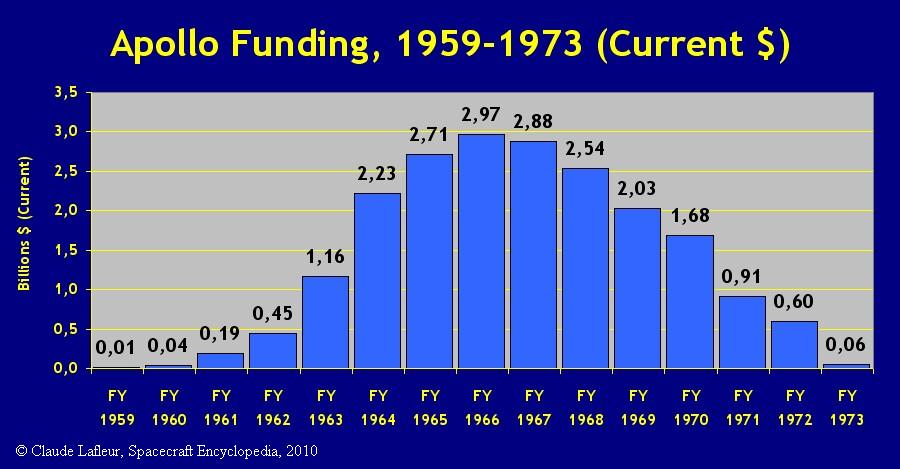
| This graph shows the amount spent by the
United States on piloted spaceflight from 1959 to 2015. It shows
the importance of the Apollo program ($100 billions spent over ten years)
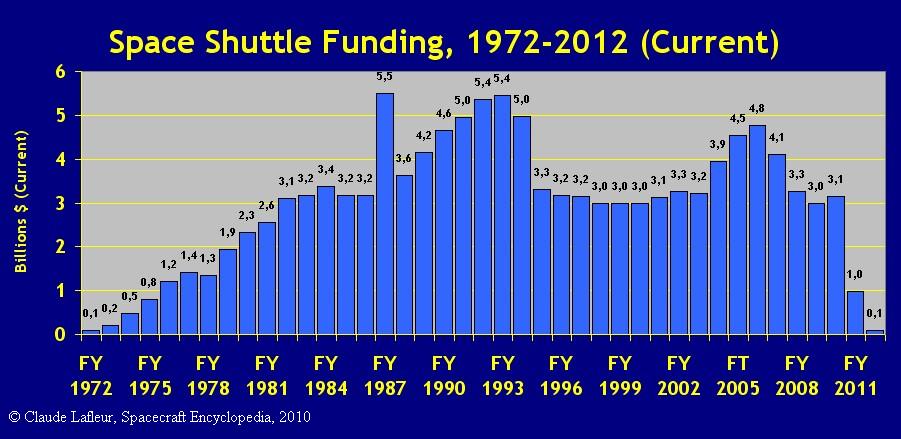
and of the Space Shuttle ($200 billions over forty years). At right,
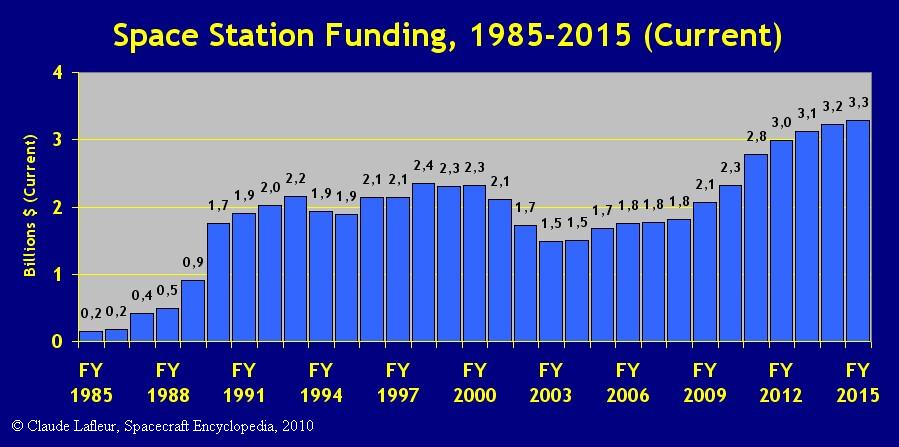
the Space Station program ($70 billions spent in thirty years) and the
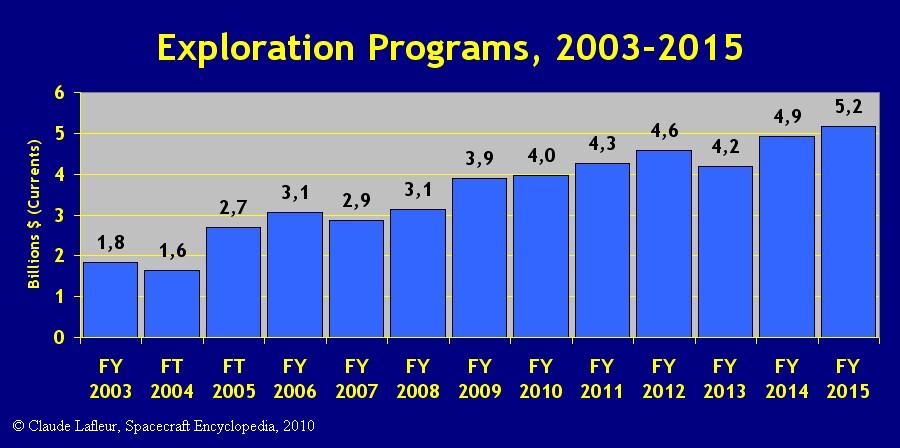
Exploration programs (nearly $50 billions in twelve years). In all,
U.S. spent $486 billions over 57 years, an average of $8.3 billions a year.
(All figures in 2010 dollars.) |
.
| Program |
Period |
Current
cost (a)
(millions $) |
End of Pro-
gram Cost (b)
(millions $) |
Cost in
2010 $ (c)
(billions $) |
| Mercury |
1959-1963 |
269 |
277 |
1.6 |
| Gemini |
1962-1967 |
1,282 |
1,342 |
7.2 |
| Apollo |
1959-1973 |
20,443 |
29.3 |
109 |
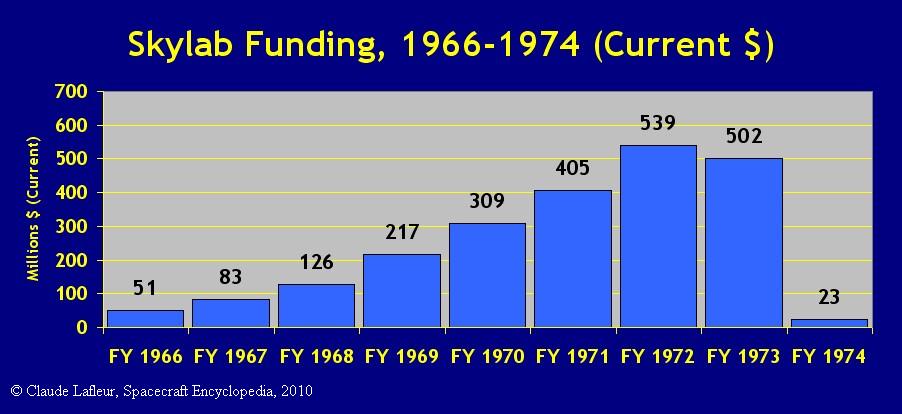
| Skylab |
1966-1974 |
2,256 |
2,786 |
10 |
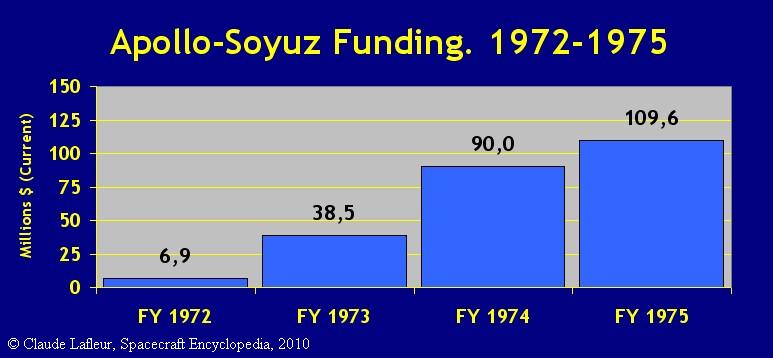
| Apollo-Soyuz |
1972-1975 |
245 |
258 |
1 |
| Space Shuttle |
1972-2012 |
123,031 |
198,569 |
199 |
| Space Station: |
. |
. |
. |
150 |
| NASA Funding |
1985-2015 |
58,695 |
72,102 |
. |
| Shuttle
flights |
1998-2010 |
n/a |
53,374 |
126 |
| Int'l
Parthners |
1986-2015 |
. |
. |
24 |
| Exploration
Programs |
2003-2015 |
46,208 |
n/a |
48 |
| Total |
1959-2015 |
274,757 |
n/a |
486 |
|
a) Adding yearly costs without
taking into account inflation. See Tables below.
b) Adding yearly costs taking
into account inflation. See Tables below.
c) Adding yearly costs in 2010
$ (rounded). See Tables below.
* See International
Space Station Total Cost below. |
| © Claude
Lafleur, Spacecraft
Encyclopedia, 2010. |
.
Some Observations
.
| Program |
Units |
(in 2010 $) |
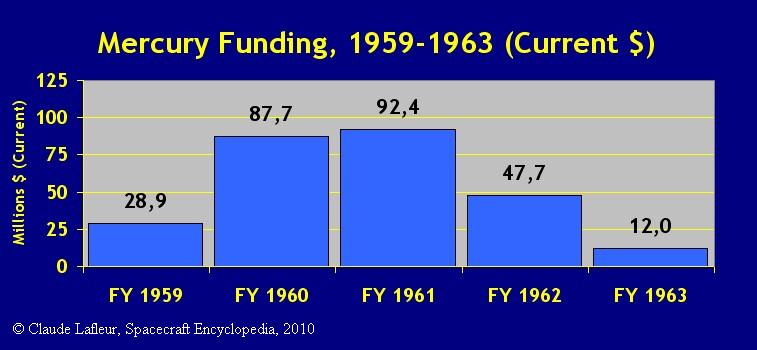
| Mercury |
6 piloted flights |
$265 millions per flight. |
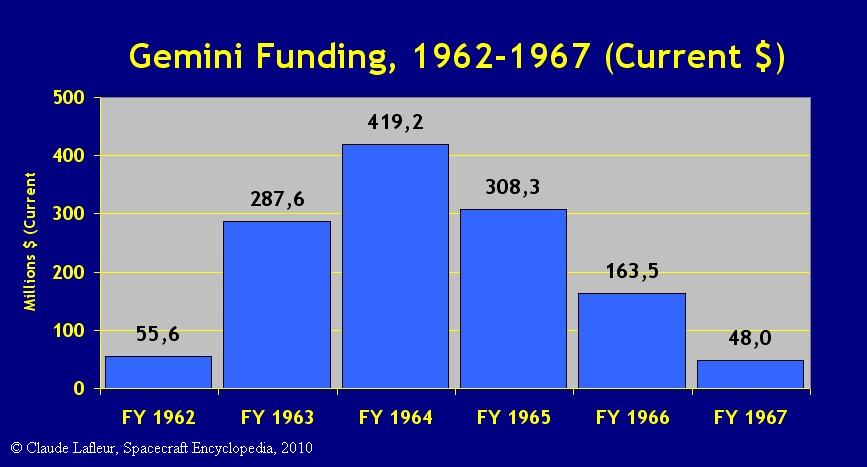
| Gemini |
10 piloted flights |
$723 millions per flight. |
| Apollo |
11 piloted flights |
$9.9 billions per flight. |
| . |
6 lunar landings |
$18 billions per lunar landing. |
| Skylab |
510 day-person |
$20.3 millionS per station-day-person. |
| Apollo-Soyuz |
NASA Funding |
$1 billion for the U.S. portion only. |
| Space Shuttle |
134 piloted flights |
$1.5 billion per flight. |
| Space Station |
20,000 day-person |
$7.5 millionS per station-day-person. |
| Exploration Programs |
ISS Budget 2003-2015 |
ThIs program expanditures are 1½ time
those of ISS. |
| Constellation Moon Program |
Total costs |
$10 billionS were spent between 2004 and
2009. |
| Total U.S. spending |
57 years |
$8.3 billions a year. |
© Claude
Lafleur, Spacecraft
Encyclopedia, 2010. |
|
.
.
| (M$) |
FY 1959 |
FY 1960 |
FY 1961 |
FY 1962 |
FY 1963 |
Total |
| Current |
28.9 |
87.7 |
92.4 |
47.7 |
12.0 |
268.7 |
| 1965 $ |
30.4 |
91.0 |
94.8 |
48.2 |
12.0 |
276.5 |
| 2010 $ |
175 |
522 |
544 |
277 |
70 |
1,588 |
|
.
Source: NASA
Historical Data Book, Vol. I: NASA Resources, 1958-1968, Table
4-22 - Research and Development Direct Obligations, by Budget Line Item
and Unique Project Number, 143th page. |
.
.
| (M$) |
FY 1962 |
FY 1963 |
FY 1964 |
FY 1965 |
FY 1966 |
FY 1967 |
Total |
| Curent |
55.0 |
287.6 |
419.2 |
308.3 |
163.5 |
48.0 |
1,282.2 |
| 1967 $ |
59.8 |
306.1 |
440.7 |
320.3 |
167.0 |
48.0 |
1,341.9 |
| 2010 $ |
322 |
1,649 |
2,374 |
1,725 |
900 |
259 |
7,330 |
|
..
Source: NASA
Historical Data Book, Vol. I: NASA Resources, 1958-1968, Table
4-22 - Research and Development Direct Obligations, by Budget Line Item
and Unique Project Number, 142th page. |
..
| (M$) |
FY 1959 |
FY 1960 |
FY 1961 |
FY 1962 |
FY 1963 |
FY 1964 |
FY 1965 |
FY 1966 |
| Current |
10.1 |
36.1 |
190.3 |
446.5 |
1,160.6 |
2,225.0 |
2,708.9 |
2,971.3 |
| 1973 $ |
16.5 |
57.9 |
301.4 |
697.3 |
1,792.3 |
3,393.8 |
4,082.7 |
4,432.3 |
| 2010 $ |
61 |
215 |
1,200 |
2,589 |
6,665 |
12,601 |
15,160 |
16,458 |
|
.
| (M$) |
FY 1967 |
FY 1968 |
FY 1969 |
FY 1970 |
FY 1971 |
FY 1972 |
FY 1973 |
Total |
| Current |
2,877.9 |
2,535.2 |
2,025.0 |
1,684.4 |
913.7 |
601.2 |
56.7 |
20,463.1 |
| 1973 $ |
4,175.4 |
3,563.0 |
2,748.2 |
2,186.4 |
1,124.4 |
704.8 |
63.4 |
29,339.7 |
| 2010 $ |
15,504 |
13,230 |
10,205 |
8,118 |
4,175 |
2,617 |
236 |
109,023 |
|
.
Sources: NASA
Historical Data Book, Vol. I: NASA Resources, 1958-1968, Table
4-22 - Research and Development Direct Obligations, by Budget Line Item
and Unique Project Number, 142th page ; NASA
Historical Data Book, Vol. III: NASA Resources, 1969-1978, Table
2-3 - Programmed Costs of Manned Spaceflight Programs. |
..
| (M$) |
FY 1966 |
FT 1967 |
FY 1968 |
FY 1969 |
FY 1970 |
FY 1971 |
FY 1972 |
FY 1973 |
FY 1974 |
Total |
| Current |
51.2 |
83.4 |
126.2 |
217.0 |
308.8 |
405.2 |
538.5 |
502.0 |
23.3 |
2,225.6 |
| 1975 $ |
75.9 |
121.0 |
177.4 |
294.5 |
400.8 |
498.6 |
631.3 |
561.7 |
25.0 |
2,786.1 |
| 2010 $ |
282 |
449 |
659 |
1,094 |
1,488 |
1,851 |
2,344 |
2,086 |
93 |
10,345 |
|
.
Source: Skylab:
A Chronology, Appendix 9 - Funding. |
.
...
.
| (M$) |
FY 1972 |
FY 1973 |
FY 1974 |
FY 1975 |
FY 1976 |
FY 1977 |
FY 1978 |
FY 1979 |
FY 1980 |
| Current |
100.0 |
198.6 |
475.0 |
797.5 |
1,206.0 |
1,412.1 |
1,349.2 |
1,936.2 |
2,332.6 |
| 2010 $ |
435 |
825 |
1,891 |
2,961 |
4,056 |
4,749 |
4,430 |
4,102 |
5,651 |
|
.
| (M$) |
FY 1981 |
FY 1982 |
FY 1983 |
FY 1984 |
FY 1985 |
FY 1986 |
FY 1987 |
FY 1988 |
FY 1989 |
| Current |
2,556.7 |
3,092,9 |
3,170.0 |
3,379.4 |
3,165.0 |
3,160.8 |
5,488.9 |
3,636.2 |
4,158.5 |
| 2010 $ |
6,377 |
6,469 |
7,196 |
6,716 |
6,701 |
6,012 |
5,788 |
6,189 |
7,028 |
|
.
| (M$) |
FY 1990 |
FY 1991 |
FY 1992 |
FY 1993 |
FY 1994 |
FY 1995 |
FY 1996 |
FY 1997 |
FY 1998 |
| Current |
4,646.3 |
4,958.9 |
5,354.3 |
5,449.7 |
4,977.3 |
3,309.0 |
3,178.8 |
3,150.9 |
2,977.8 |
| 2010 $ |
7,611 |
7,818 |
8,140 |
7,984 |
7,113 |
4,623 |
3,350 |
4,222 |
3,914 |
|
.
| (MS) |
FY 1999 |
FY 2000 |
FY 2001 |
FY 2002 |
FY 2003 |
FY 2004 |
FY 2005 |
FY 2006 |
FY 2007 |
| Current |
2,998.3 |
2,979.5 |
3,118.8 |
3,270.0 |
3,208.0 |
3,945.0 |
4,543.0 |
4,777.5 |
4.107.6 |
| 2010 $ |
3,874 |
3,803 |
3,931 |
4,038 |
3,870 |
4,671 |
5,273 |
5,947 |
4,502 |
|
.
| (MS) |
FY 2008 |
FY 2009 |
FY 2010 |
FY 2011 |
FY 2012 |
FY 2013 |
Total |
|
| Current |
3,266.7 |
2,979.5 |
3,101.4 |
1,609.7 |
664.9 |
79,9 |
124,276.7 |
|
| 2010 $ |
3,466 |
3,069 |
3,101 |
1,640 |
690 |
85 |
199,879 |
$1,480 millions/flight |
|
.
Note: In 2010, it was decided
to add a 135th flight to the Space Shuttle program (which was supposed
to end after 134 flights). This new flight adds $1,243 billion to the program,
thus confirming the $1,5 billion per flight average. That is to say
that each new flight would had add $1,2 billion in direct additional fee.)
Sources : NASA
Historical Data Book, Vol. III: NASA Resources, 1969-1978, Table
2-3 - Programmed Costs of Manned Spaceflight Programs ; NASA
Historical Data Book, Vol. V: NASA Resources, 1979-1988, Table
31 - Total Human Spaceflight Funding History, 151-152th pages ; NASA
Historical Data Book, Vol. VII: NASA Resources, 1989-1998, Table
21 - Authorized/Appropriated Budget (FY 1989FY 1998), 73th page ;
NASA
Budgets Documents, FY 1997 to FY 2010. |
..
.
| (MS) |
FY 1985 |
FY 1986 |
FY 1987 |
FY 1988 |
FY 1989 |
FY 1990 |
FY 1991 |
FY 1992 |
| Current |
155.5 |
184.7 |
420.0 |
489.5 |
900.0 |
1,749.6 |
1,900.0 |
2,029.0 |
| 2010 $ |
295.3 |
338.2 |
745.0 |
848.6 |
1,521.0 |
2,865.9 |
2,995.3 |
3,084.6 |
|
.
| (MS) |
FY 1993 |
FY 1994 |
FY 1995 |
FY 1996 |
FY 1997 |
FY 1998 |
FY 1999 |
FY 2000 |
| Current |
2,162.0 |
1,939.2 |
1,889.6 |
2,143.6 |
2,148.6 |
2,351,3 |
2.304.7 |
2,323.1 |
| 2010 $ |
3,137.6 |
2,771.2 |
2,640.2 |
2,933.6 |
2,878.9 |
3,090.7 |
2,978.1 |
2,964.9 |
|
...
| (MS) |
FY 2001 |
FY 2002 |
FY 2003 |
FY 2004 |
FY 2005 |
FY 2006 |
FY 2007 |
FY 2008 |
| Current |
2,112.9 |
1,721.7 |
1,492.1 |
1,498.0 |
1,676.3 |
1,753.4 |
1,762.6 |
1,813.2 |
| 2010 $ |
2,663.0 |
2,126.1 |
1,799.8 |
1,773.6 |
1,946.6 |
1,983.0 |
1,931.7 |
1,923.6 |
|
.
| (MS) |
FY 2009 |
FY 2010 |
FY 2011 |
FY 2012 |
FY 2013 |
FY 2014 |
FY 2015 |
Total |
| Current |
2,060.2 |
2,317.0 |
2,779.8 |
2,983.6 |
3,129.4 |
3,221.8 |
3,182.8 |
58,695 |
| 2010 $ |
2,060.0 |
3,317.0 |
2,779.8 |
2,983.6 |
3,129.4 |
3,221.8 |
3,182.8 |
72,400 |
|
.
Sources: NASA
Historical Data Book, Vol.V: NASA Resources, 1979-1988, Table 31
- Total Human Spaceflight Funding History (in thousands of dollars, 151th
page; NASA Historical Data Book, Vol.VII: NASA Resources, 1989-1998,
Table
33 - Programmed Budget (FY 19891998), 141th page; NASA
Budget Information, FY 1997 to FY 2010. |
.
Space
Station Total Costs
.
.
| (B$) |
NASA
Funding |
Shuttle
flights* |
U.S.
Total |
Russia
(est.) |
Europe
(est.) |
Japan
(est.) |
Canada
(est.) |
Total |
| 2010 $ |
72 |
54 |
126 |
12 |
5 |
5 |
2 |
150 |
| Percent |
|
|
84.0% |
8.0% |
3.3% |
3.3% |
1.3% |
100% |
|
* Shuttle flights = 36 missions
toward ISS at $1.5 billions each.
© Claude
Lafleur, Spacecraft
Encyclopedia, 2010. |
.
.
| (M$) |
FY 2004 |
FY 2004 |
FY 2005 |
FY 2006 |
FY 2007 |
FY 2008 |
FY 2009 |
Subtotal |
| Current % |
1,214.5 |
1,646.0 |
2,684.5 |
3,050.1 |
2,869.8 |
3,399.4 |
3,900.5 |
18,669.8 |
|
Advanced R&D |
1,214.5 |
1,646.0 |
|
|
|
|
|
2,860.5 |
|
Constellation |
|
|
526.0 |
1,733.5 |
2,114.7 |
2,675.9 |
3,033.1 |
10,083.2 |
|
Exploration Systems Research |
|
|
722.8 |
692.5 |
|
|
|
1,415.3 |
|
Prometheus Nuclear System |
|
|
431.7 |
|
|
|
|
431.7 |
|
Human System Research |
|
|
1003.9 |
624.1 |
|
|
|
1,628.0 |
|
Advanced Capabilities |
|
|
|
|
755.1 |
623.5 |
472.3 |
1,850.9 |
| In 2010 $ |
1,465.0 |
1,948.8 |
3,115.7 |
3,449.4 |
3,145.0 |
3,500.0 |
4,022.7 |
20,646.9 |
. |
.
| (M$) |
FY 2010 |
FY 2011 |
FY 2012 |
FY 2013 |
FY 2014 |
FY 2015 |
Subtotal |
Total |
| Current |
3779.8 |
4,263.4 |
4,577.4 |
4,178.9 |
4,923.3 |
5,179.3 |
27,442.1 |
46,111.9 |
| In 2010 $ |
3779.8 |
4,263.4 |
4,577.4 |
4,178.9 |
4,923.3 |
5,179.3 |
27,442.1 |
48,089.0 |
|
|
Note: no budgetary details were
provided for FY 2010-FY2015 Exploration progrtams.
Source: NASA
Budgets Documents, FY 2004 to FY 2010. |
|