| On October 4, 2017, I had published
an eBook, written in French and titled Spoutnik @ 60, which relate
60 years of space activities, what we have done, what we have learn and
what we had gain from space. This book contains the most recent data
on space activities, including stats and a chapter on the True space pay-offs.
It's a 200-page book available at amazon.com. |
 |
.
|
.
.
|
Presentation
of The Spacecraft Encyclopedia
|
| Why an encyclopedia on all spacecraft ever
launched? Because, beyond all projects, plans, "what we will do..." and
"what we could have done if...", this is what Space exploration and operations
are all about.
This website tries to present the most comprehensive
views of all spacecraft ever launched (successfully or not) sponsored by
every governments, organizations and corporations since October 1957. With
more some 7,500 spacecraft, this encyclopedia represents a collossal endeavour
which is only possible by starting with the works of such "giants" as Jonathan
McDowell, Mark Wade,
Asif
Siddiqi, NASA
Historians,
NSSDC and many
other sources.
The basic data for each spacecraft are presented
in an entry written in "plain english", trying to be as accurate and concise
as possible. Entries are grouped by year of launch, that is: entries for
all spacecraft launched in a given year are on the same web page. Additional
informations are available from the web links presented at the bottom of
each entry.
See also: Spacecraft
stats and insights, an introductory essay published in Space
Review on April 5, 2010. |
.
|
Everything You Ever
Wanted To Know About Spacecraft !
|
.
.
.
..
.
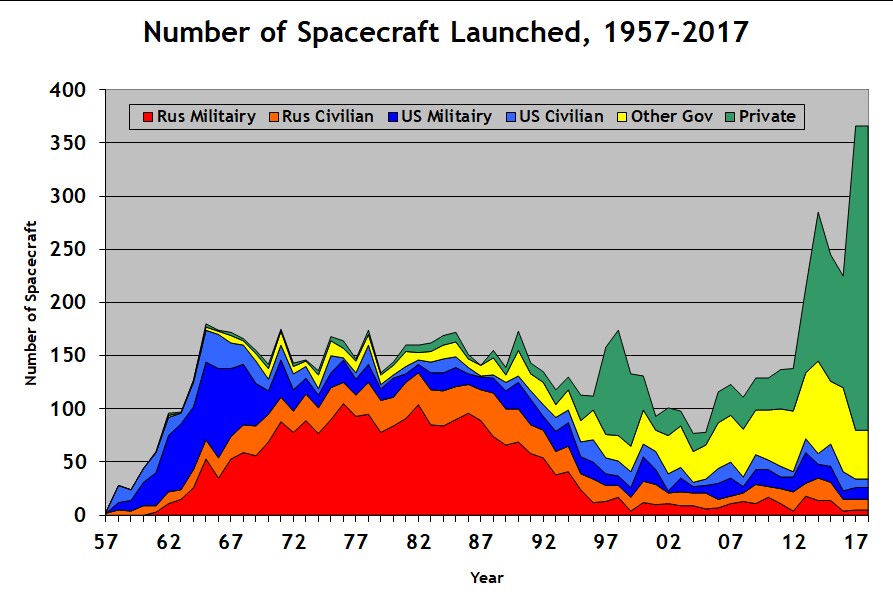
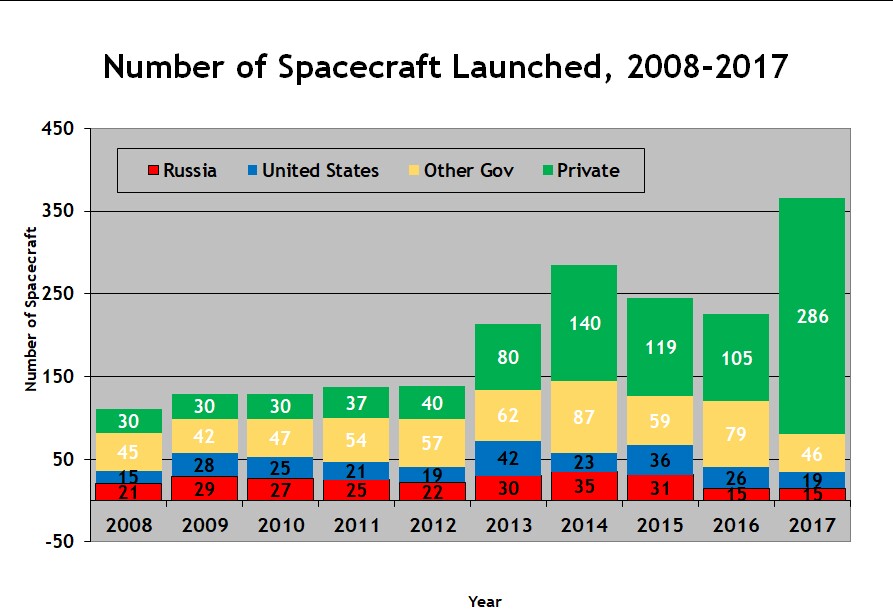
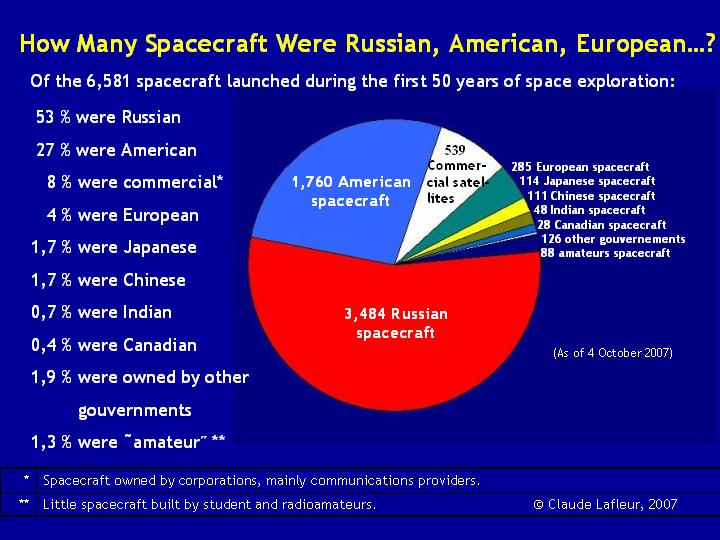
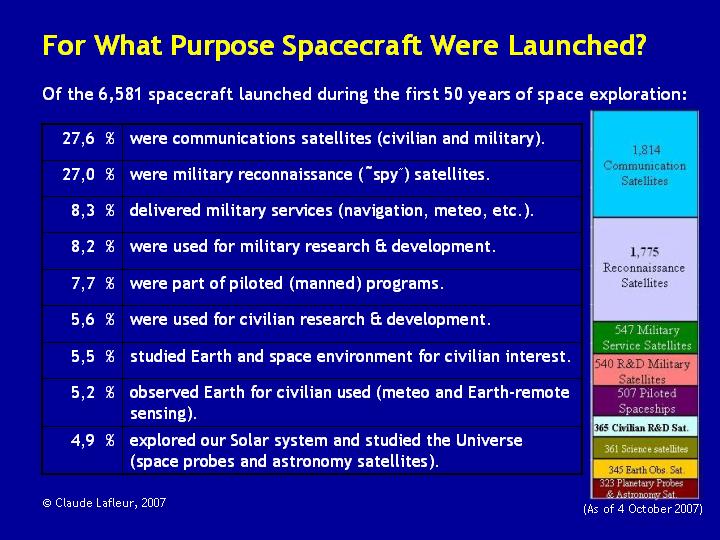
Since 1957, we are launching an average of 143
spacecraft per year. In all, 8,593 spacecraft were launched between 1957
and Oct. 4, 2017. They included satellite (in Earth orbit), piloted spaceship
and planetary probe. The left graph shows the number of spacecraft launched
every year. Color red represents spacecraft launched for Russia,
blue represents spacecraft launched for the United
States, yellow represents other governments (Europe,
Japan,
China,
India,
Canada,
Israel
& Other governments)
and green represents non-governmental spacecraft (commercial
and amateur/student).
This graph shows that 44% of spacecraft were launched for Russia, 24% for
the Unitd States, 13% for other governments and 18% for non-governemental
entities (private sector and amateur/student). The graph at right shows
the number of spacecraft launched in the last ten years (2008-2017, Oct.
4). In the last five years, more than 200 spacecraft were launched each
year; about 10% for Russia and for the United States, 25% for other governments
and 55% for non-government. (Click on each graph to enlarge.)
|
.
| Yearly
Summary of Spacecraft Launched |
.
.
.
.
|
The
Encyclopedia Megatables
|
.
The table below presents
the number of spacecraft launched every year. Il also gives access to the
main lists that formed this encyclopedia.
| |
To view all spacecraft
launched on a given year, click on the year in the first colum of the table. |
| |
To view all Russian,
or all American, or all European... spacecraft, click on the country name
on top of the table. |
| |
To view the list of
all, or Russian, or American, or European, etc. spacecraft launch on a
given year, click on the appropriate number in the colums. |
| |
Each list give spacecraft names. Click on
one of them to access the entry giving main data on this mission. |
|
.
|
Table I - Number
of Spacecraft Launched Each Year
|
.
| Source:
©
Claude
Lafleur's Spacecraft Encyclopedia, 2005-2017 |
.
|
Spacecraft by Weight
Categories
In 2013, a new era began with the launch
of 96 microsatellites (weighting less than 10 kg). This new era jumped
the number of spacecraft launched during a year, from around 130 to more
than 200. The table below gives the number of spacecraft launched
each year according to their weight. There are, accordingly, the full-fledge
spacecraft (weighting at least 100 kg), the microsatellite (less than 10
kg) and the small spacecraft (10-99 kg). This table shows that there
are about a hundred full-fledge spacecraft launched every year, about ten
small spacecraft and a dozen or so microsatellites before 2013, and many
dozens thereafter.
|
'Full-fledge' spacecraft
(>100 kg) |
Small satellite
(10 - 99 kg) |
Microsatellite
(<10 kg) |
Total |
| 2010 |
105 spacecraft = 81.4 % |
6 spacecraft = 4.7 % |
18 spacecraft = 13.9 % |
129 spacecraft |
| 2011 |
115 spacecraft = 83.9 % |
10 spacecraft = 7.3 % |
12 spacecraft = 8.8 % |
137 spacecraft |
| 2012 |
103 spacecraft = 74.6 % |
9 spacecraft = 6.5 % |
26 spacecraft = 18.8 % |
138 spacecraft |
| 2013 |
107 spacecraft = 50.1 % |
11 spacecraft = 5.0 % |
96 spacecraft = 44.9 % |
214 spacecraft |
| 2014 |
125 spacecraft = 43.9 % |
30 spacecraft = 10.5 % |
130 spacecraft = 45.6 % |
285 spacecraft |
| 2015 |
115 spacecraft = 46.9 % |
20 spacecraft = 8.7 % |
110 spacecraft = 44.9 % |
245 spacecraft |
| 2016 |
117 spacecraft = 52.0 % |
18 spacecraft = 8.0 % |
90 spacecraft = 40.0 % |
225 spacecraft |
| 2017
(As of Oct. 4) |
87 spacecraft = 23.4 % |
18 spacecraft = 4.9 % |
261 spacecraft = 71.3 % |
366 spacecraft |
| Total |
874 spacecraft = 50.3 % |
122 spacecraft = 7.0 % |
743 spacecraft = 42.7 % |
1739 spacecraft |
|
.
Table 2 - Main Statistics
(as of 4 October 2017)
|
.
|
|
1957-2017 |
Yearly average |
Percent |
| |
Total Number of Spacecraft
Launched: |
8,593 spacecraft |
143 spacecraft/year |
|
|
(See complete lists: 1957-1999
and 2000-2014) |
|
|
|
| . |
|
|
|
|
| |
Number of Russian
Spacecraft: |
3,743 spacecraft |
62 spacecraft/year |
43.6 % |
| |
Number of American
Spacecraft: |
2,022 spacecraft |
34 spacecraft/year |
23.5 % |
| |
Number of Other Governements
Spacecraft:
(Europe,
Japan,
China,
India,
Canada,
Other) |
1,300 spacecraft |
2=2 spacecraft/year |
15.1 % |
| |
Number of Commercial
Spacecraft: |
1,162 spacecraft |
19 spacecraft/year |
13.5 % |
| |
Number of Amateur
Spacecraft: |
366 spacecraft |
6 spacecraft/yeat |
4.3 % |
|
(See Table
3) |
|
|
|
| . |
|
|
|
|
| |
Number of Civilian
Spacecraft: |
4,519 spacecraft |
75 spacecraft/year |
52.6 % |
| |
Number of Military
Spacecraft: |
4,074 spacecraft |
67 spacecraft/year |
47.4 % |
|
(See Table
4) |
|
|
|
| . |
|
|
|
|
| |
Number of Successfull
Spacecraft: |
spacecraft |
spacecraft/year |
% |
| |
Number of FailedSpacecraft: |
spacecraft |
spacecraft/year |
% |
|
(See Table
6) |
|
|
|
| . |
|
|
|
|
|
Civilian Programs: |
|
|
|
| |
Number of Piloted
Spaceships (+ 35 military): |
610 spacecraft |
10 spacecraft/year |
7.1 % |
| |
Number of Planetary
Probes: |
248 spacecraft |
4 spacecraft/year |
2.9 % |
| |
Number of Communications
Satellites: |
1,381 spacecraft |
23 spacecraft/year |
16.1 % |
| |
Number of Meteorology
Satellites: |
241 spacecraft |
4 spacecraft/year |
2.8 % |
|
(See Table
8) |
|
|
|
| . |
|
|
|
|
|
Military Satellites: |
|
|
|
| |
Number of Surveillance
(''spy) Satellites:
(photo,
ellint,
ocean,
missile
surveillance): |
1,913 spacecraft |
32 spacecraft/year |
22.3 % |
| |
Number of Military
Services Satellites:
(communications,
navigation, meteo,
etc.) |
1,511 spacecraft |
25 spacecraft/year |
17.6 % |
|
(See Table
9) |
|
|
|
|
| Source:©
Claude
Lafleur's Spacecraft Encyclopedia, 2005-2017 |
.
|
Military
vs. Civilian Spacecraft Launched
|
.
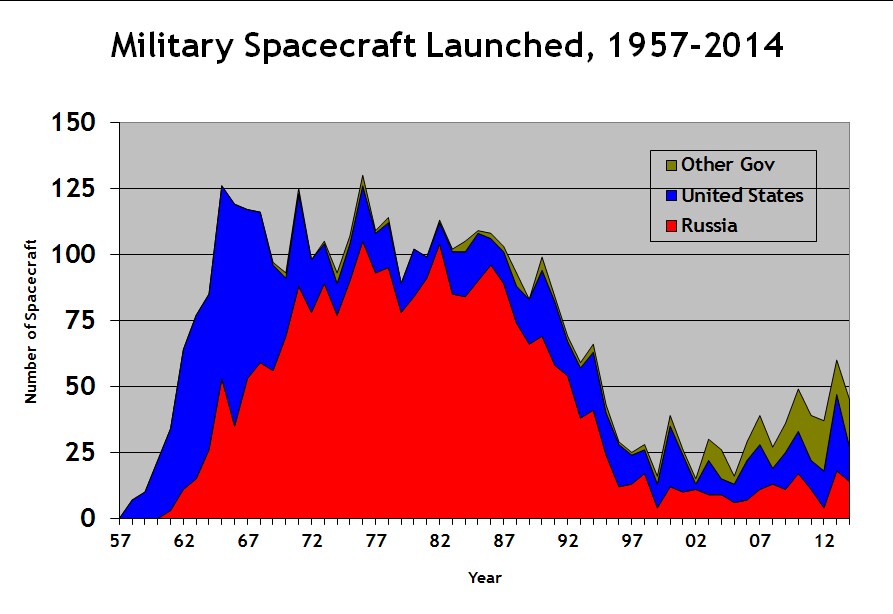
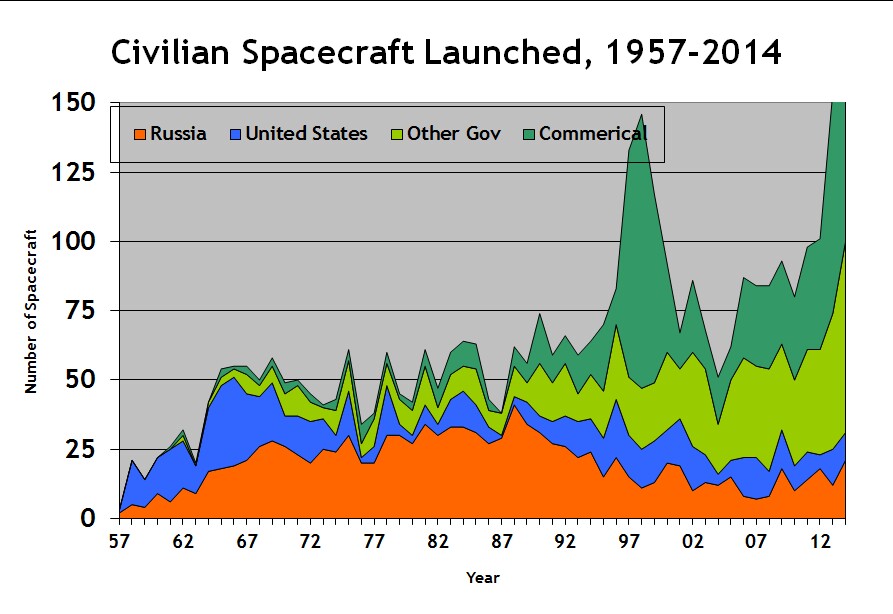
| These two graphs traced
the evolution of the number of military and civilian spacecraft launched
from 1957 to 2014. The graph at left shows that the majority of military
spacecraft were launched by the Soviet Union during the 1970s and 1980s
(red), and a net decrease during the last fifteen years. About 30 military
spacecraft were launched in recent years. The graph at right shows civilian
spacecraft launched; in general, the numbers are relatively constant throughout
the last 50 years (about 75 a year), except for a "surge" in commercial
spacecraft launched at the end of the 1990s (green). And since 2013, we
are seeing a record number of civilian spacecratf launched (154 and 240
for 2013 and 2014). (Click on each graph to enlarge.) |
.
.
|
Table 10 - Number
of Spacecraft Launched by Family
|
..
.
.
| Space Exploration |
Space Applications |
R & D |
|
|
|
|
| Space Exploration: |
Space Applications: |
R & D: |
1,424 Spacecraft
(16.6 %) |
2,234 Spacecraft
(26.0 %) |
815 Spacecraft
(9.5 %) |
|
|
| Source:
©
Claude
Lafleur's Spacecraft Encyclopedia, 2005-2017 |
.
.
.
| Military Applications |
Military Services |
R & D |
|
|
|
|
| Military Applications: |
Military Services: |
R & D: |
1,913 Spacecraft
(22.3 %) |
1,511 Spacecraft
(17.6 %) |
663 Spacecraft
(7.7 %) |
|
|
| Source:
©
Claude
Lafleur's Spacecraft Encyclopedia, 2005-2017 |
.
.
.
|
Table 11 - Launchers
Ranking
|
.
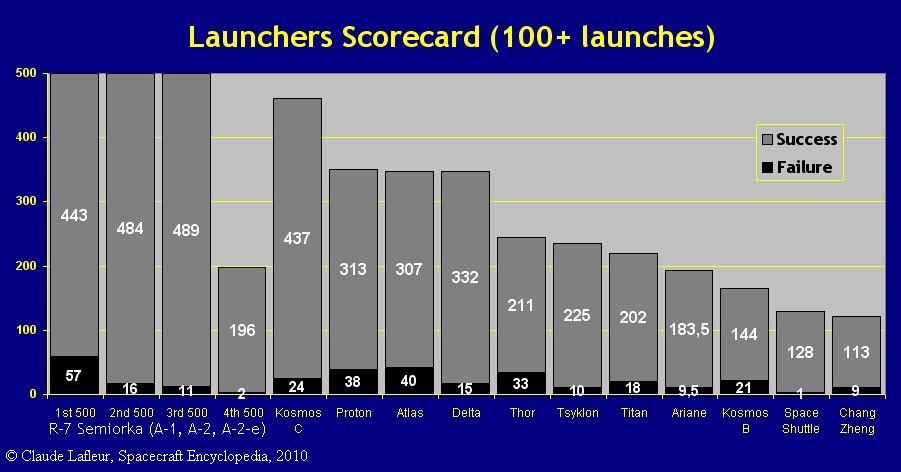
| These graphs show the
launch rate of all launchers. The graph at left shows the 12 launchers
which had been launched more than 100 times. The central graph shows the
14 launchers which had been launched between 10 and 99 times. The graph
at right shows the 21 launchers which had been launched less than 10 times.
(Click on each graph to enlarge.) |
.
| Rank |
Launcher
Family |
Launch
Success |
Launch
Failure |
Total
Launches |
Success
Rate |
Number
of Payload
Carried |
Percent
of Total
Payload
Carried |
First
Launch
-
Last
Launch
|
| . |
|
|
|
|
|
|
|
|
| 1 |
Saturn |
28 |
0 |
28 |
100 % |
46 |
0.59 % |
1961
- 1975 |
| 2 |
Minotaur |
16 |
0 |
16 |
100 % |
82 |
0.95 % |
2000 - 2017 |
| 3 |
Vega |
10 |
0 |
10 |
100 % |
25 |
0.29 % |
2012 - 2017 |
| 4 |
Space
Shuttle |
134 |
1 |
135 |
99.26 % |
278 |
3.58 % |
1981
- 2011 |
| 5 |
Soyuz
(Semiorka) (Russia-era) |
370½ |
7½ |
378 |
98.02 % |
580 |
6.75 % |
1992
- 2017 |
| 6 |
Rokot |
26 |
1 |
27 |
96.30 % |
73 |
0.85 % |
1994 - 2016 |
| 7 |
Tsyklon |
225 |
10 |
235 |
95.74 % |
363 |
4.68 % |
1964
- 2009 |
| 8 |
Ariane |
228½ |
10½ |
239 |
95.61 % |
432 |
5.02 % |
1979
- 2017 |
| 9 |
Dnepr |
21 |
1 |
22 |
95.45 % |
163 |
1.90 % |
1994 - 2015 |
| 10 |
Delta |
359 |
18 |
377 |
95.23 % |
517 |
6.02 % |
1960
- 2017 |
| 11 |
Chang
Zheng |
239 |
13 |
252 |
94.84 % |
366 |
4.26 % |
1969
- 2017 |
| 12 |
Kosmos
C |
438 |
24 |
462 |
94.81 % |
847 |
10.92 % |
1964
- 2010 |
| - |
A
/ Semiorka (Soviet-era) |
1,362 |
84 |
1,446 |
94.19 % |
1,497 |
19.30 % |
1957
- 1991 |
| 13 |
N |
14 |
1 |
15 |
93.33 % |
164 |
1.91 % |
1975
- 1987 |
| 14 |
Pegasus |
40 |
3 |
43 |
93.02 % |
94 |
1.09 % |
1990
- 2016 |
| 15 |
Titan |
202 |
18 |
220 |
91.82 % |
332 |
4.28 % |
1964
- 2005 |
| 16 |
H |
52 |
5 |
57 |
91.23 % |
118 |
1.52 % |
1986
- 2017 |
| 17 |
Proton |
378 |
38 |
416 |
90.87 % |
584 |
6.45 % |
1965
- 2015 |
| 18 |
Atlas |
363 |
38 |
401 |
90.52 % |
688 |
8.01 % |
1958
- 2017 |
| 19 |
R-36 |
22½ |
2½ |
25 |
90.00 % |
25 |
0.32 % |
1965 - 1971 |
| 20 |
Falcon |
42 |
5 |
47 |
89.36 % |
125 |
1.45 % |
2006 - 2017 |
| 21 |
Scout |
87 |
12 |
99 |
87.80 % |
111 |
1.46 % |
1960
- 1994 |
| 22 |
Kosmos
B |
144 |
21 |
165 |
87.27 % |
165 |
2.13 % |
1961
- 1977 |
| 23 |
Thor |
213 |
31 |
244 |
87.03 % |
348 |
4.46 % |
1958
- 1965 |
| 24 |
Mu
/ M-V |
26 |
4 |
30 |
86.67 % |
36 |
0.46 % |
1970
- 2006 |
| 25 |
Zenit |
71 |
11 |
82 |
86.59 % |
104 |
1.34 % |
1985
- 2014 |
| 26 |
Diamant |
10 |
2 |
12 |
83.33 % |
15 |
0.19 % |
1965
- 1965 |
| 27 |
SLV
(India) |
49½ |
11½ |
61 |
81.15 % |
283 |
3.29 % |
1979
- 2017 |
| 28 |
Juno,
Jupiter, Redstone |
12 |
10 |
22 |
54.55 % |
22 |
0.28 % |
1958
- 1961 |
| 29 |
Vanguard |
3 |
8 |
11 |
27.27 % |
11 |
0.14 % |
1957
- 1959 |
| . |
|
|
|
|
|
|
|
|
|
Strela |
3 |
0 |
3 |
100 % |
3 |
0.04 % |
2003 - 2014 |
|
Kuaizhou |
2 |
0 |
2 |
100 % |
2 |
0.03 % |
2013 - 2014 |
|
Shtil' |
2 |
0 |
2 |
100 % |
3 |
0.04 % |
1998 - 2006 |
|
Angara |
1 |
0 |
1 |
100 % |
1 |
0.01 % |
2014 |
|
Epsilon |
1 |
0 |
1 |
100 % |
2 |
0.02 % |
2013 - 2017 |
|
Start |
6 |
1 |
7 |
85.71 % |
9 |
0.12 % |
1993 - 2006 |
|
Antares |
4 |
1 |
5 |
80.00 % |
97 |
1.13 % |
2013 - 2016 |
|
Shaviyt |
8 |
2 |
10 |
75.00 % |
10 |
0.12 % |
1998 - 2016 |
|
Athena |
5 |
2 |
7 |
71.43 % |
10 |
0.10 % |
1995 - 2001 |
|
Taurus |
6 |
9 |
9 |
66.67 % |
22 |
0.28 % |
1999 - 2014 |
|
KT
/ Kaituozhe |
4 |
2 |
6 |
66.67 % |
8 |
0.09% |
2002 - 2017 |
|
Safir |
3 |
(2) |
(5) |
(60.00 %) |
4 |
0.05 % |
2009 - 2017 |
|
Feng
Bao |
4 |
4 |
8 |
50.00
% |
12 |
0.15 % |
1994
- 1998 |
|
Energiya |
1 |
1 |
2 |
50.00
% |
2 |
0.03 % |
1987
- 1988 |
|
Black
Arrow |
1 |
1 |
2 |
50.00
% |
2 |
0.03 % |
1994 |
|
Lambda |
1 |
4 |
5 |
20.00 % |
5 |
0.06 % |
1966 - 1970 |
|
KSLV |
1 |
2 |
3 |
33.33 % |
2 |
0.03 % |
2019 - 2013 |
|
Uhna |
1 |
2 |
3 |
33.33 % |
3 |
0.04 % |
2009 - 2012 |
|
Conestoga |
0 |
1 |
1 |
0 % |
1 |
0.01 % |
1998 |
|
Super Stryiti |
0 |
1 |
1 |
0 % |
13 |
0.15 % |
2015 |
|
Electron |
0 |
1 |
1 |
0 % |
1 |
0.01 % |
2017 |
|
SS 520 |
0 |
1 |
1 |
0 % |
1 |
0.01 % |
2017 |
|
Volna |
0 |
1 |
1 |
0 % |
1 |
0.01 % |
2005 |
|
VLS |
0 |
3 |
3 |
0 % |
4 |
0.05 % |
1993
- 1997 |
|
N-1 |
0 |
4 |
4 |
0 % |
4 |
0.05 % |
1969
- 1972 |
|
Europa |
0 |
4 |
4 |
0 % |
4 |
0.05 % |
1968
- 1971 |
|
NOTS |
0 |
6 |
6 |
0 % |
6 |
0.08 % |
1958 |
|
|
|
|
|
|
|
|
|
|
Total |
5,246 |
435 |
5,681 |
92.35 % |
8,593 |
100 % |
1957
- 2017 |
|
| Source:
©
Claude
Lafleur's Spacecraft Encyclopedia, 2005-2017 |
.
|
Table 12 - National
Score
|
.
| Nation |
Successful
Launches |
Launch
Failures |
Total |
Success
Rate |
% of Total
Launches |
Spacecraft
Launched |
% of spacecraft
launched |
| Russia |
3,073.. |
206.. |
3,279 |
93.72 % |
57.72 % |
4,395... |
51.1 % |
| United States |
1,517.. |
157.. |
1,674 |
90.62 % |
29.47 % |
2,804... |
32.6 % |
| Europe |
249½ |
17½ |
267 |
93.43 % |
4.70
% |
493... |
5.7 % |
| China |
247.. |
19.. |
266 |
92.86 % |
4.68
% |
386... |
4.5 % |
| Japan |
95.. |
15.. |
110 |
86.36 % |
1.94
% |
208... |
2.4 % |
| India |
49½ |
11½ |
61 |
81.15 % |
1.07
% |
283... |
3.3 % |
| Israel |
68
. |
2.. |
10 |
80.00 % |
0.18
% |
10... |
0.1 % |
| Iran |
4 . |
0 . |
8 |
100 % |
0.06
% |
4... |
0.1 % |
| Brazil |
0.. |
3.. |
3 |
00.00 % |
0.06
% |
4... |
0.1 % |
| South Korea |
1.. |
2.. |
3 |
33.33 % |
0.06
% |
3... |
0.0 % |
| North Korea |
2.. |
2.. |
3 |
33.33 % |
0.06
% |
3... |
0.0 % |
| Total |
5,546 . |
435.. |
5,681 |
92.34 % |
100.00 % |
8,593... |
100 % |
|
| Source:
©
Claude
Lafleur's Spacecraft Encyclopedia, 2017 |
..
|
Table 13 - Modern, Commercial
Launchers Scoreboard
|
(As of December 31,
2014)e
.
| Rank |
.. |
Launcher |
Number of Launches |
In services |
Success Rate |
Remarks |
| 1) |
|
Atlas
V |
50 success in 50
launches |
2002-2014 |
100 % |
All launches successful. (Note
1) |
| 2) |
|
Falcon
9 |
12.8 sucess in 13 launches |
2010-2014 |
98.8 % |
Last 7 launches
successful.(Note 2) |
| 3) |
|
Chang
Zheng |
141 success in 144 launches |
>2000-2014 |
97.9 % |
Last 16 launches
successful. (Note 3) |
| 4) |
|
Soyuz
Soyuz-U
Soyuz-FG
Soyuz-2
Other type |
190½ success
in 195 launches
87 success in 89 launches
49 success in 49 launches
42½ success in 44 launches
12 success in 13 launches |
2000-2014
>2000-2014
2001-2014
2006-2014
2000-2010 |
97.7 %
97.0 %
100 %
96.36%
92.3 % |
Last 8 launches successful.
(Note 3)
(First Soyuxz-U launched in
1973) |
| 5) |
|
Delta
4 |
26 success in 27
launches |
2002-2014 |
96.3 % |
Last 23 launches successful. |
| 6) |
|
Ariane
V |
73½ success
in 77 launches |
1996-2014 |
95.5 % |
Last 65 launches successful |
| 7) |
|
Dnepr |
19 success in 20
launches |
1999-2014 |
95.0 % |
Last 14 launches successful. |
| 8) |
|
Pegasus |
39 success in 42
launches |
1990-2013 |
92.9 % |
Last 28 launches successful. |
| 9) |
|
Proton
M |
78 success in 85
launches |
2001-2014 |
91.8 % |
Last 4 launches successful. |
| 10) |
|
Rokot |
21 success in 23
launches |
1994-2014 |
91.3 % |
Last 7 launches successful |
| 11) |
|
Zenit-3 |
41 success in 45
launches |
1999-2014 |
91.1 % |
Last 2 launches successful. |
| 12) |
|
SLV |
27 success in 31
launches |
>2000-2014 |
87.1 % |
Last 12 launches successful. |
| 13) |
|
H-II |
32 success in 37
launches |
1994-2014 |
86.5 % |
Last 24 launches successful. |
| 14) |
|
Antares |
4 success in 5
launches |
2013-2014 |
80 % |
Last launch failed. |
.
| Note 1: |
The last Atlas failure dated
back to March 1993; since then, 122 successful launches were made. |
| Note 2: |
The fourth
launch of a Falcon 9 achieve orbit even though one of its first-stage
engine had an anomaly. The second stage compensated to reach orbit, although
extra propellant was used and stage 2 did not restart as planned. We consider
this launch a 80% success. |
| Note 3: |
This launcher was in service well before
the year 2000, but we consider its carrier as a commercial launcher from
that year on. |
|
| Source:
©
Claude
Lafleur's Spacecraft Encyclopedia, 2015 |
.
50 Years of Space Exploration
it Two Graphs
| These two graphs summarized the first 50
years of space exploration by answering two questions: who launched spacechips
and for what purpose? Click on each graph to view the answer. |
.
| Some Interesting Spacecraft
Families |
.
.
|